
Data visualisation and its application in SMEs
02 Mar 2023. 11:09
1 min. of reading
Published by
Imagen colaborador
Acelera pyme
Términos de uso
You can use the resource for personal or informative use with attribution to the entity red.es following our terms of use.
Image
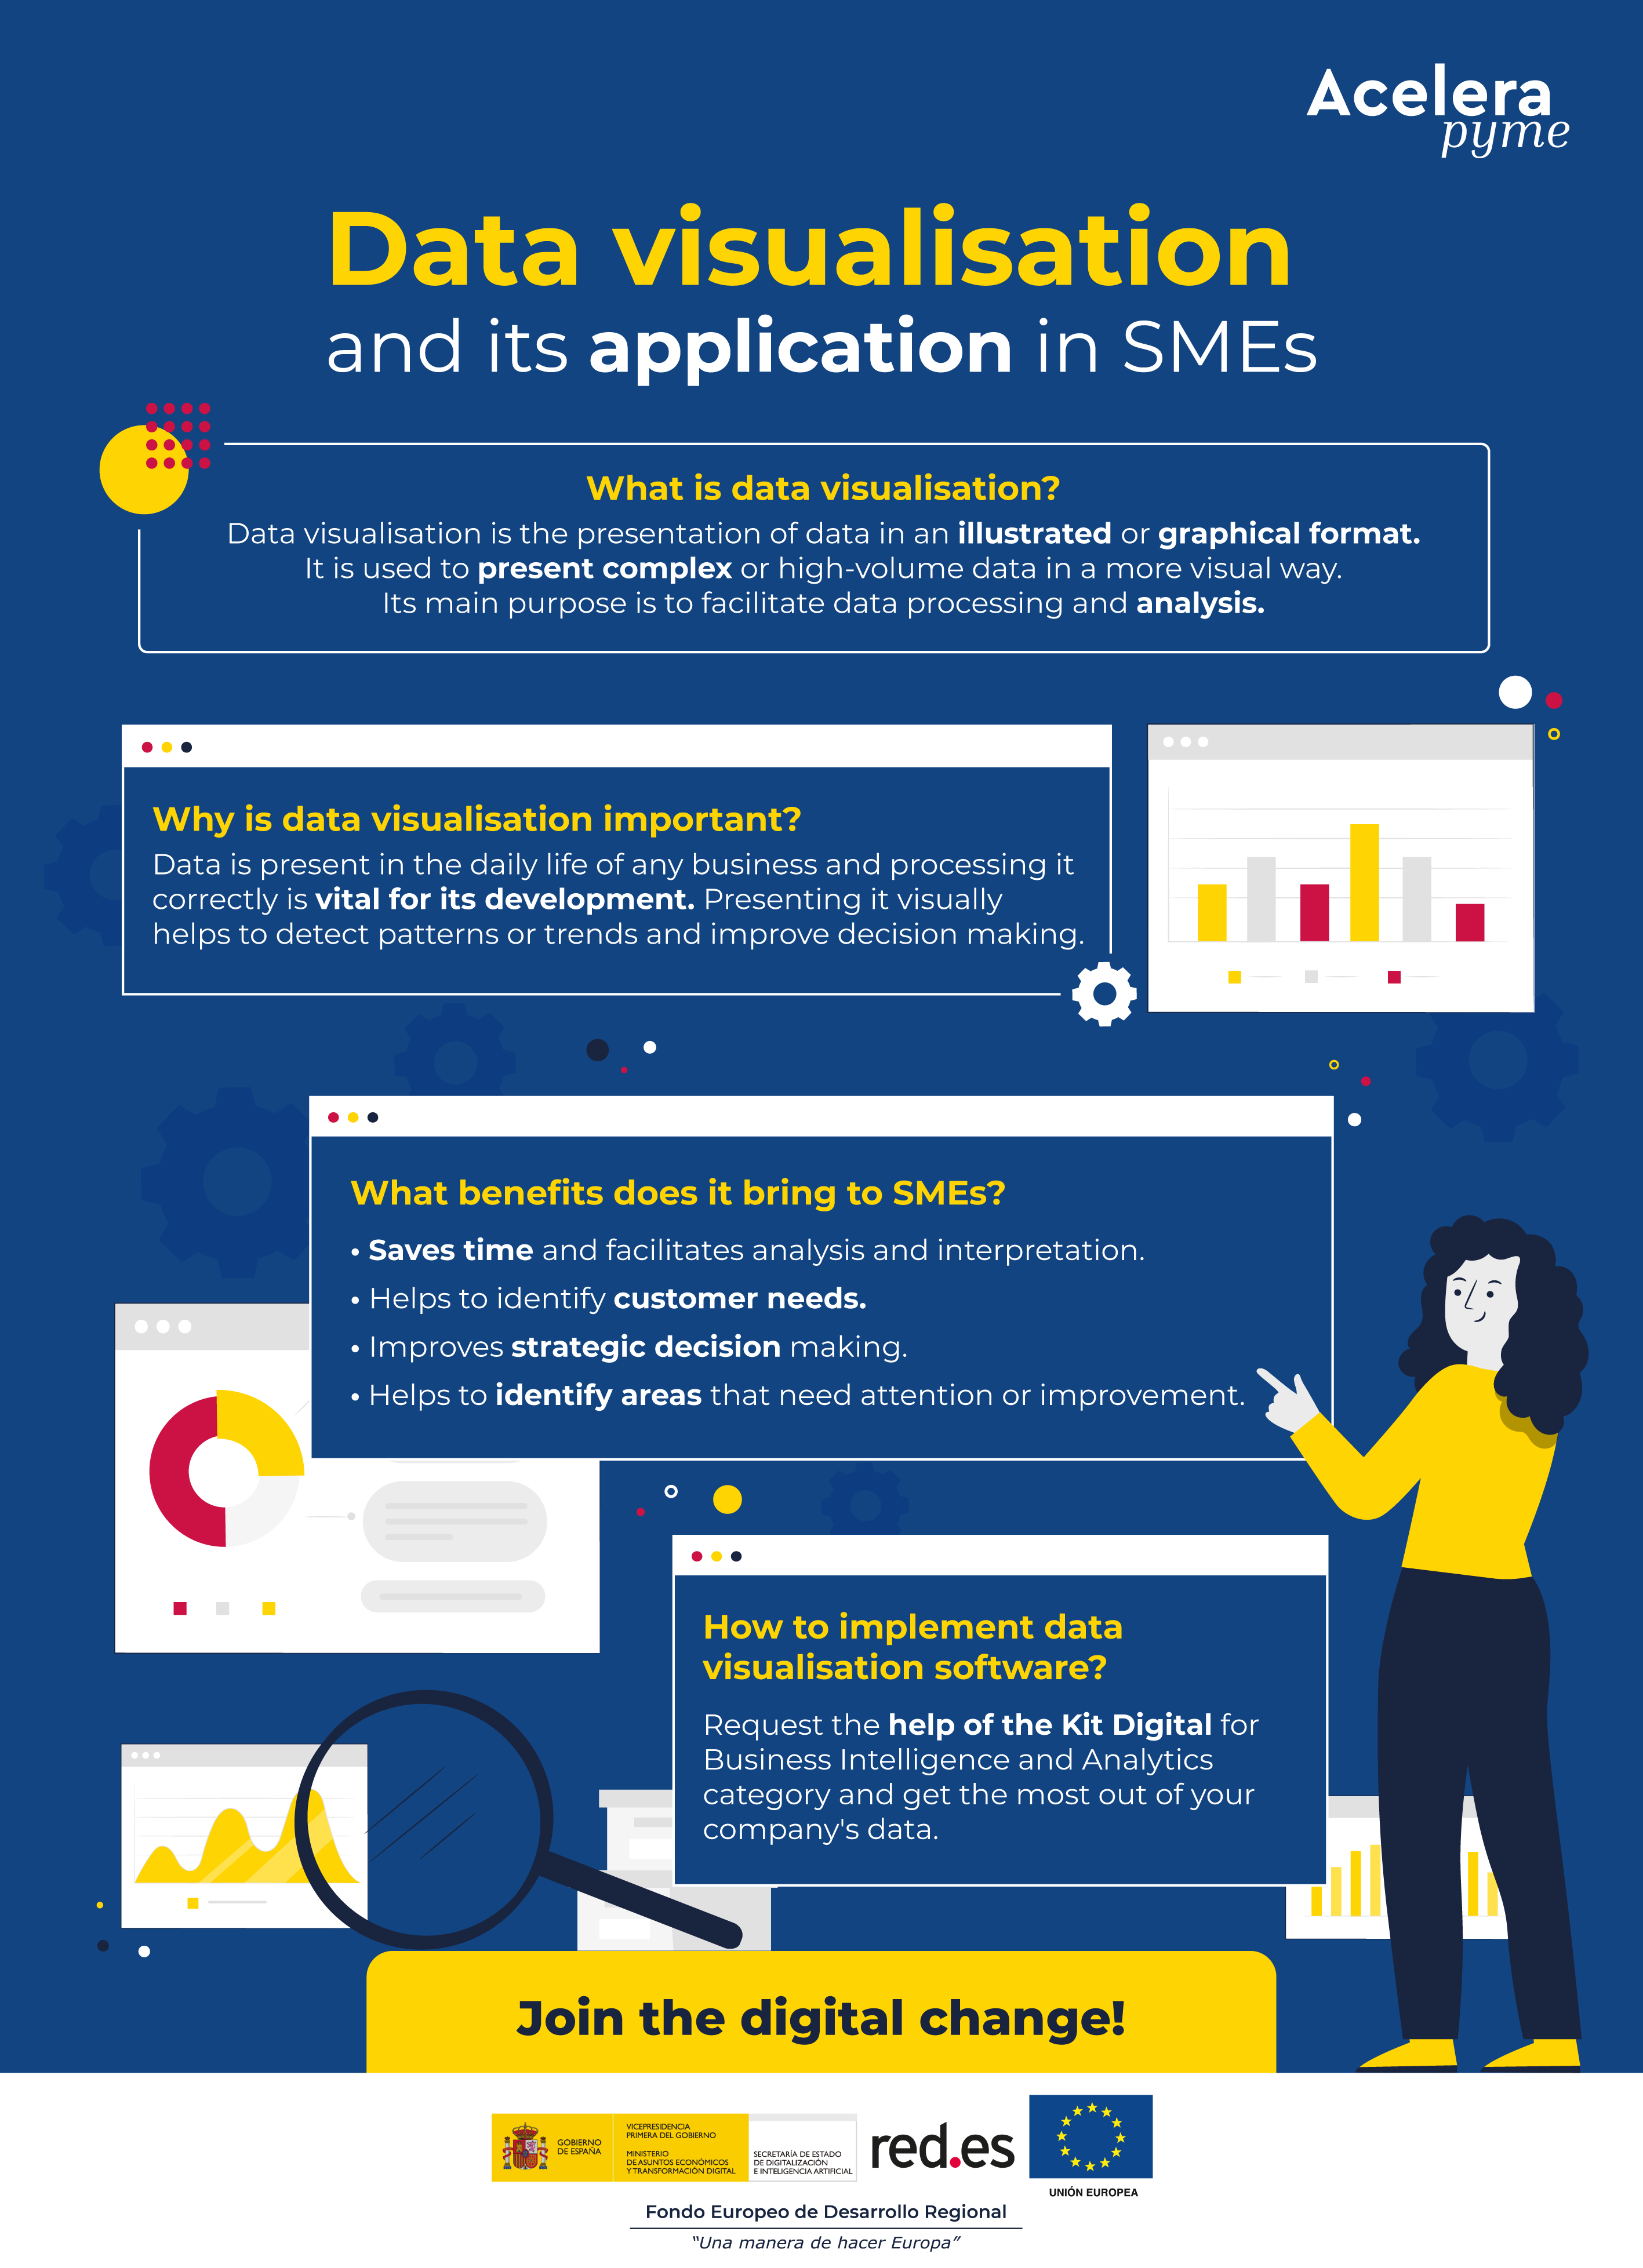
What is data visualisation?
- Data visualisation is the presentation of data in an illustrated or graphical format.
- It is used to present complex or high-volume data in a more visual way.
- Its main purpose is to facilitate data processing and analysis.
Why is data visualisation important?
Data is present in the daily life of any business and processing it correctly is vital for its development. Presenting it visually helps to detect patterns or trends and improve decision making.
What benefits does it bring to SMEs?
- Saves time and facilitates analysis and interpretation.
- Helps to identify customer needs.
- Improves strategic decision making.
- Helps identify areas that need attention or improvement.
How to implement data visualisation software?
Request the help of the Kit Digital for Business Intelligence and Analytics category and get the most out of your company's data.
Join the digital change!


